We will work safely or not at all

01

Client requirements

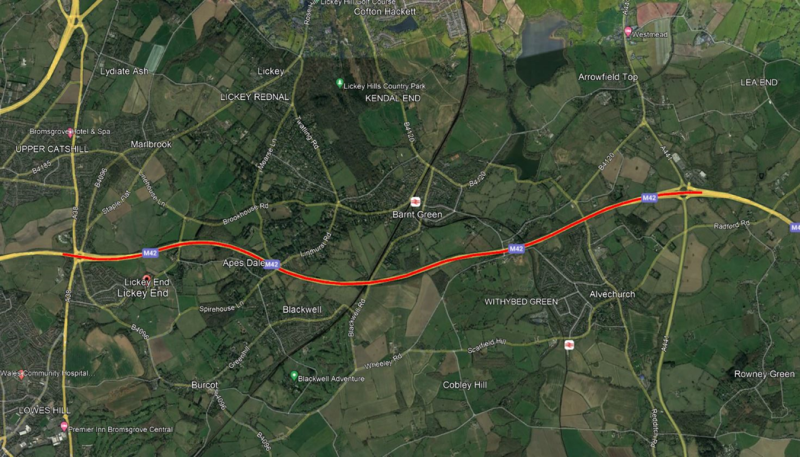
We were tasked by our client to determine the condition of the filter drains between Junction 1 and Junction 2 of the M42. A distance of 6725m was covered by a total of 54 swaths on the West and East bound verges.

Filter drains are gravel filled trenches that collect and transport water as well as treating pollution. A trench is filled with free draining gravel, together with a perforated pipe in the bottom to collect the water. Over time their ability to remove water from the pavement surface and surrounding area degrades as result of sediment build up within the media. Floating water brings further blocking agents that fill the existing voids within the media. Those blocking agents can be small size particles, such as sand and grit.

The objective of the survey therefore was to measure the extent and severity of the clogging within the filter media in accordance with the UK Highways Agency’s Design Manual for Roads and Bridges CS551: Section 5.

02

40Seven Solution

A Ground Penetrating Radar (GPR) survey was conducted according to the recommendations in CS 551: Section 5, to determine the service condition of the filter drains.

We used a Quad Bike to tow our Stream DP GPR system to conduct the survey. The Stream DP is a multichannel GPR array system operating in dual polarization, which provides an accurate 3D visualization of the drains in a single scan. A survey grade GPS antenna was mounted onto the Quad Bike to capture real-time coordinates of the GPR unit, which allows the surveyed locations to be accurately mapped and revisited at a later stage to clean and reinstate the media where required.

The radar outputs a series of sine waves with linearly increasing frequency. These frequency series are transmitted into the pavement/structure and reflections from material boundaries or embedded features (construction material, re-bars, services, or voids) are detected by the receivers. By assessing the amplitude, phase, and the scatter of received signals, it is then possible to determine the build-up of sediment within void spaces in the filter media.

The multi-channel GPR can detect voids and separation within or between material layers by mapping changes in the amplitude of radio energy reflected from a material boundary or from within a homogeneous material. Radar travels at the speed of light, so small void spaces appear larger on the radar grams. Also, when an air gap is encountered the radar signal amplitude increases significantly allowing relatively simple discrimination to be made. The moisture within a layer effectively slows the travel of the radar signal through it which produces a distinctive dip in the layer’s lower interface.

Martyn Utley
Business Development Manager
Contact 40Seven
03

The results

The GPR data was post-processed using Geolitix universal GPR processing software to analyse the GPR results.

As part of our analysis, we apply various filters to enhance the precision of GPR data interpretation. These filters are crucial for refining the information obtained. The filters include:

  1. Velocity Adjustment: provides for accurate depth and thickness measurements.
  2. Time Zero Corrections: ensures accurate alignment and interpretation of the GPR data.
  3. Background Subtraction: eliminates ambient signals, allowing for clear focus of data.
  4. Manual Gain: optimizes the visualization of specific features and improves overall clarity.
  5. Time Cut: Removes unwanted data, streamlining the analysis to the relevant timeframe.
  6. Frequency Filter: enhances the detection of materials or structural elements.
  7. Hilbert Transform: enables a more detailed analysis of amplitude and phase characteristics.


By incorporating these filters into our analysis, we enhance the accuracy and effectiveness of our GPR survey, providing a comprehensive understanding of the structure under investigation.

Once processed, the GPR data showed the filter drains were predominately in good condition and the majority were categorized as Grade 3 indicating that they still have a good void ratio.

The example table below shows a series of swaths, their lengths, locations, grades and void ratio’s, together with a RAG assessment for easy identification of areas requiring remediation.

The two example swath charts below show the raw GPR scans together with the void ratio by way of a heat chart, where red shows a poor void ratio, orange shows an adequate void ratio and green shows a good void ratio. This representation takes the detailed scan data and simplifies it to highlight the precise locations that need to be visited and remiediated. This means that only areas with poor void ratios are remediated resulting in a more cost effective service.


Explore Our Solutions

Industry-leading surveying services, delivering the right data at the right time.